Home  /  Industries  /  Pest Control Industries · Pest Control

Route density pays for trucks. Windshield time doesn't.

Recurring agreements, seasonal surges, and routes that scatter as you grow — pest control is a numbers business that almost nobody runs on numbers. We wire the model, the cash curve, and the dials so every route, truck, and price decision gets rehearsed before it's made.
The pains we see

You don't have a reporting problem. You have a visibility problem.

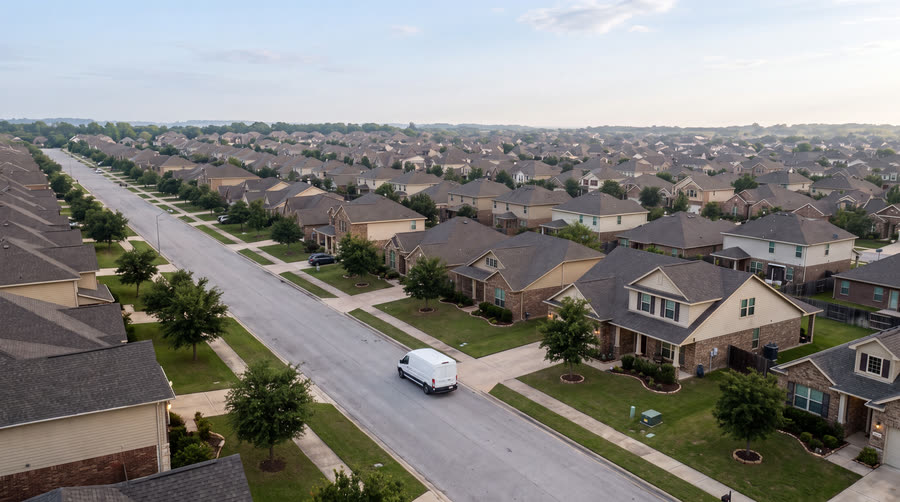
Growth scatters the routes.

Every new door adds stops — and quietly adds miles between them. Density falls, windshield time rises, and revenue per route-day sinks while the topline grows.

Summer cash hides the winter burn.

The surge months feel rich, the trough months get survived. Almost no operator can name their winter burn rate — so trucks and hires get bought at exactly the wrong time.

Pricing is folklore.

Without cost per stop, price increases are guesses and escalators go uncaptured. The margin difference between your best and worst route is usually double digits — and invisible.

The multiple lives in the recurring book.

At exit, buyers pay for recurring revenue percentage and churn — numbers most operators see for the first time in diligence, when it's too late to improve them.

The dials we wire

The numbers that actually run a pest control company.

Every engagement starts by wiring these to your reality — your data, your definitions, posted live. If a dial doesn't change a decision, it doesn't make the wall.

Revenue per route-day Stops per tech-day Route density — stops/mile Windshield time % Chemical cost per stop Recurring revenue % Monthly churn / cancel-saves Average contract value Seasonal cash curve Tech utilization Escalator capture CAC per new door

The dials are the standard for the industry — the thresholds, targets, and drill-downs are designed around how your operation actually makes money.

What we build

Four builds, in your language.

Each one plays as a two-minute film — the same build we'd run on your numbers.

THE OPERATING MODEL

Routes × stops × ticket, with seasonality curves and tech capacity — so the next truck, hire, or territory gets tested on paper first.

Watch the build →
THE CASH RHYTHM

A 12-month cash curve that prices the winter trough in advance — and a monthly rhythm that keeps the plan honest.

Watch the build →
THE COMMAND CENTER

Route P&L, churn watch, and density dials — live, not at year-end. Two clicks from “margin dipped” to the route that caused it.

Watch the build →
THE VALUATION

Recurring percentage and churn drive the multiple. Know your number — and what builds it — years before a buyer names theirs.

Watch the build →

A $6M, five-route operator — what changes

THE BLIND SPOT

Summer masked a winter burn near six figures; two routes ran twelve points below the best one and nobody knew which two.

THE BUILD

Driver model on routes × stops × ticket, the cash curve, and a command center with a route P&L page and churn watch.

THE DIFFERENCE

The next truck was bought in September on evidence, the weakest route was re-densified, and the recurring book became a managed number — not a diligence surprise.

Bring us the decision you're weighing.

A free consultation — 15 minutes. We'll talk about your operation in its own language, and what the build would look like on your numbers.

Request a consultation